Environment
As a manufacturing company with our own products, we have a special responsibility for the environment. We aim to handle resources and energy responsibly and continually improve, reducing our environmental impact and contribution to climate change. We consider all processes in the manufacturing process from raw material extraction to installation and throughout the product lifecycle. Our strategy involves consistently measuring all necessary KPIs to then install targeted and sustainable measures. Our goal is to provide products with the lowest possible environmental footprint.
Sustainable Product Design
Our products are designed for maximum durability and longevity, ensuring the safety and resilience of energy networks. By leveraging intelligent, simulation-based design, we minimise material usage and environmental impact. Throughout the design process, we investigate the use of recycled raw materials, prioritise ease of maintenance and repair, and compliance with European regulations (RoHS, REACH) to enhance sustainability and regulatory adherence.
Resource-Efficient Solutions for Energy Infrastructure
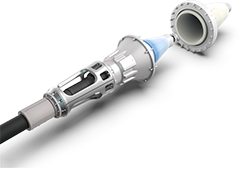
With its pluggable CONNEX connection system, PFISTERER makes a significant contribution to the transformation of energy infrastructure. A key aspect of the system is its suitability for so-called “clean air” switchgear. In this context, the commonly used, climate-damaging insulating gas sulfur hexafluoride (SF₆) is replaced by an alternative insulating medium based on natural components of ambient air such as oxygen and nitrogen.
In addition, the CONNEX system stands out due to its durable and robust design. The pluggable technology enables easy installation, reduces material and space requirements, and minimizes maintenance efforts over the entire lifecycle. Its qualification for high-voltage applications underscores its high reliability and supports efficient long-term use of resources.
DOC High-Voltage Terminations
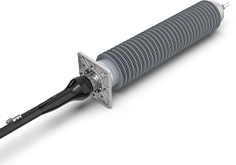
With the DOC (Dry Outdoor Composite) product family, PFISTERER relies on an intelligent design of high-voltage terminations throughout their entire lifecycle. The oil- and gas-free insulation technology prevents potential leakages and emissions while simultaneously increasing operational safety. The dry design helps reduce potential environmental impacts and minimizes risks for both people and the environment.
In addition, DOC terminations are designed for durability, low maintenance, and efficient use of resources. The reduced installation effort can lower material and energy consumption, while the high reliability contributes to efficient power transmission. In this way, PFISTERER supports the expansion of modern power grids and the integration of renewable energy sources.
SEANEX High-Voltage Connection System
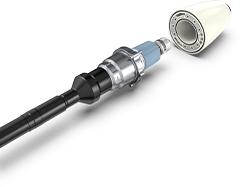
PFISTERER’s SEANEX high-voltage connection system is a prime example of innovative product design in the field of renewable energy. As a key interface in offshore wind farms, it enables the reliable integration of renewable energy into the power grid, thereby making a direct contribution to decarbonization. Its durable, maintenance-free design for operating periods of at least 25 years under extreme offshore conditions reduces failure risks and resource-intensive maintenance activities while increasing overall system efficiency.
A contribution to efficient resource use is reflected in the intelligent system architecture: pre-assembled, pluggable components shorten installation times and minimize material and energy consumption. At the same time, the robust, separable connection technology enables targeted reuse and the replacement of individual components. The avoidance of SF₆ gas further highlights the approach of reducing climate-damaging emissions. Overall, SEANEX combines efficiency and durability, thereby supporting a sustainable and future-ready energy supply.
Actions
During the year, we made significant progress toward our sustainability targets:
Transition to electric vehicles: As part of our electrification policy, newly leased vehicles are now electric. Non-electric vehicles are being phased out, with exceptions only for regions lacking charging infrastructure or specialised installation vehicles.
Charging infrastructure: Electric vehicle charging stations were installed for employees at Winterbach, Gussenstadt, and Kadan.
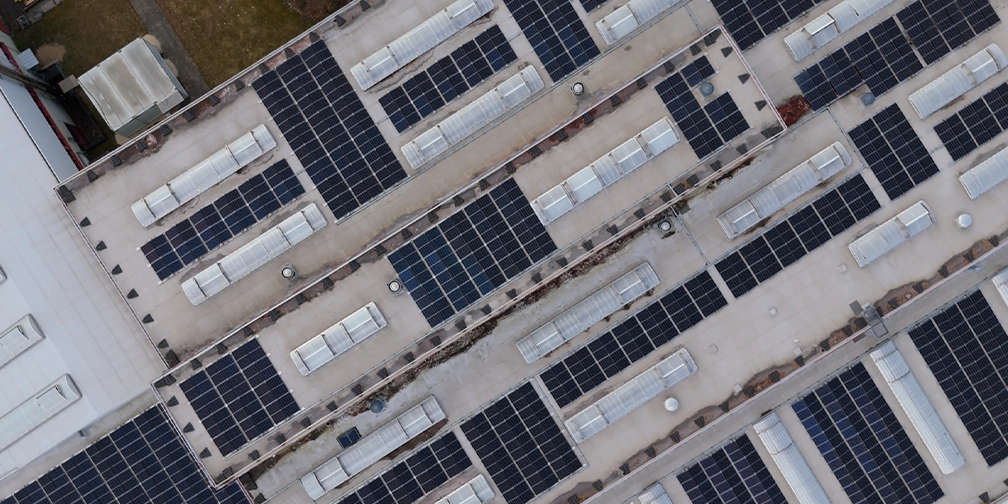
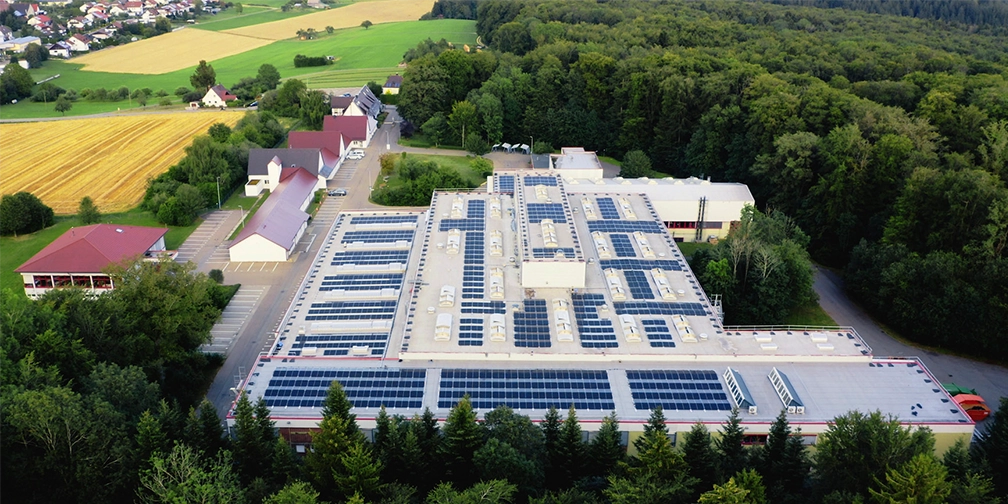
Photovoltaic expansion: A photovoltaic system in Gussenstadt generated 156,000 kWh of renewable electricity in 2025.
Renewable energy usage: The Kadan facility now sources 100% of its electricity from renewable sources.
Energy efficiency measures: LED lighting has been expanded across multiple sites to reduce energy consumption.
Climate change education: Over 100 employees completed interactive online or offline courses on climate change and practical ways to reduce emissions, reflecting strong engagement.
Environmental Product Declarations (EPDs): Multiple EPDs have been developed to provide transparency on the environmental impact of our products.
SF6 detection systems: SF6 detection systems have been installed in testing facilities to detect and prevent potential leaks early.
Circular economy initiatives: Metal scrap is returned to suppliers to support circular material use.
Compressed air optimisation: Compressed air leaks were identified and minimised to reduce energy loss.
Future Actions
Looking ahead, we are advancing the following initiatives:
Global renewable energy sourcing: Expand renewable energy sourcing worldwide, targeting 100% renewable electricity by 2030.
Photovoltaic expansion: Install additional photovoltaic systems across our facilities.
Vehicle fleet electrification: Continue electrifying our company vehicle fleet, aiming for 80% electric vehicles by 2029.
Wood chip heating plant: Replace natural gas heating in Gussenstadt with district heating from a wood chip plant by the end of 2026.
ISO 50001 implementation: Extend energy management systems to all production sites in 2026.
Scope 3.1 reduction projects: Launch projects in 2026 to reduce upstream emissions.
Targets and Key Figures*
In 2024, we established binding environmental targets through 2030, ensuring robust management and transparent measurement of our most significant environmental impacts. In 2025, we achieved measurable progress: Scope 1 emissions were reduced through the electrification of the company fleet and the mitigation of SF6 leaks in our testing facilities. Market-based Scope 2 emissions decreased, primarily due to sourcing renewable electricity for our main production plant. In addition, energy intensity improved further as a result of efficiency initiatives.
|
|
|
Actual values |
||||
|---|---|---|---|---|---|---|---|
Indicator |
Target |
2025 |
2024 |
2023 |
2022 |
2020 |
|
|
CO2e Emissions Scope 1 (t CO2e) |
Reduce by 90% by 2029 compared to 2020 without carbon offsets. Net Zero by 2030 through the use of carbon offsetting for remaining emissions. |
2,102 |
3,190 |
3,694 |
4,588 |
4,942 |
|
CO2e Emissions Scope 2, market-based (t CO2e) |
Reduce by 90% by 2029 compared to 2020 without carbon offsets. Net Zero by 2030 through the use of carbon offsetting for remaining emissions. |
172 |
1,868 |
3,418 |
2,908 |
3,294 |
|
CO2e Emissions Scope 3.1 Intensity (t CO2e / revenue in million EUR) |
Reduction by 30% per EUR revenue by 2030 compared to 2023 without compensation. |
238 |
225 |
271 |
– |
– |
|
Energy Intensity (MWh / revenue in million EUR) |
Reduction by 51% per EUR revenue by 2030 compared to 2020. |
36.96 |
47.29 |
56.51 |
75.66 |
72.13 |
|
Share of Recycled Waste (%) |
Increase to 85% by 2030 |
74.44 |
74.86 |
82.76 |
80.97 |
81.75 |
* For detailed information, please see our comprehensive GHG and KPI report available for download on our website.
Scope 1 and 2: Pathway to reduce Scope 1 and 2 market-based emissions to meet 2029 target

CO2e Emissions: Scope 1, 2, 3*
Our greenhouse gas (GHG) emissions are calculated in accordance with the international GHG Protocol standard. To ensure its core principles—relevance, completeness, consistency, transparency, and accuracy—our GHG inventory and calculation processes are independently verified by a third party on an annual basis. The inventory provides valuable insights into where the largest emissions occur and identifies the areas where we can exert direct or indirect influence.
|
Actual values |
||||
|---|---|---|---|---|---|
(t CO2e) |
2025 |
2024 |
2023 |
2022 |
2020 |
Scope 1 |
2,102 |
3,190 |
3,694 |
4,588 |
4,942 |
Scope 2 (market-based) |
172 |
1,868 |
3,418 |
2,908 |
3,294 |
Scope 2 (location-based) |
3,134 |
4,475 |
4,706 |
4,187 |
4,448 |
Scope 3.1 |
107,140 |
86,055 |
90,646 |
– |
– |
Scope 3 (including 3.11) |
298,765 |
233,915 |
270,692 |
– |
– |
Scope 3 (excluding 3.11) |
128,551 |
101,462 |
106,248 |
– |
– |
Total GHG emissions |
301,039 |
238,974 |
277,803 |
– |
– |
* For detailed information, please see our comprehensive GHG and KPI report available for download on our website.